Once you have your controls in place, how do you know they’re working? Learn how data analytics can help you detect fraud with these 10 fraud indicators.
Accounts payable (AP) fraud is one of the most common types impacting organizations. To combat this risk, organizations design controls within AP applications, or in their purchase-to-payments processes. But just because an anti-fraud measure has been put in place doesn’t necessarily mean it’s effective.
Fraudsters are often cunning. They usually find ways to get around your controls. So how can you find out if fraud is happening?
It’s a good idea to start by using data analytics—an effective way to uncover indicators you wouldn’t otherwise notice. Here are 10 fraud indicators data analytics can help you uncover.
1. Duplicate payments
If a vendor receives a monthly payment from an organization, a fraudster may try to process it twice in one month and divert the funds into their own account. It’s very easy to claim this is an error. On the other side, shady vendors might know there are weaknesses in payment controls and try to submit the same invoices, hoping they’ll be paid twice.
Another way duplicate payments slip through unnoticed is when an invoice payment is made both through a standard purchase order (PO) system, as well as a “one-off” vendor expense system. This can happen if an employee forgets or never requests a PO for the expense.
Data analytics can help perform a number of tests on your data to find duplicate payments. It can look for combinations of duplicates related to invoice details (e.g., invoice number, vendor name, date, amount). It can also examine anomalies. Is there a transaction with matching data, but a different invoice number? Is there a transaction with the same invoice number, amount, and date, but for a different vendor number?
2. Split purchase orders and split payment approvals
Let’s say, for example, an employee can approve POs and invoice payments up to $2,000. They know that no one else needs to sign-off except them. Anything higher than $2,000 goes for additional sign off from senior managers. So how do they process sizeable fraudulent payments? By breaking them up into increments of $2,000, thus circumventing the control.
This sort of fraud is easily detected with data analytics. Simply look for any series of PO approvals or payments within a given time frame and that are within, say, 5% of an individual’s authorization limit.
3. Phantom vendors
The Association of Certified Fraud Examiners estimates that businesses lose 5% of their annual revenue to employee fraud and abuse. One common employee fraud scheme involves phantom vendors—an employee sets up a fictitious or unauthorized vendor account and submits invoices or process payments for non-existent or fraudulent goods and services.
Data analytics can find these schemes by looking for matches between data in separate systems, like vendor and employee HR systems. Simple tests include looking for matches of employee data and vendor account data. For example, matching addresses, bank account numbers, telephone numbers, and tax ID numbers.
4. Purchases of consumer items
Another type of employee fraud involves a manager with purchasing authority ordering materials or services for their own personal use, rather than the organization’s.
A simple data analysis test is to look for keywords associated with consumer or home-use items. Create a data table that includes a list of all suspicious words (e.g., particular vendor names, like “Home Depot” or “Amazon” and item descriptions, like “garage shelving”).
Other tests include listing suspect merchant codes (if available) like those relating to home goods, vacations, or luxury items. Or find matches between a shipping address for something ordered from a vendor and an employee address.
5. “Flip flop” vendor master file changes
Fraud detection data analytics don’t have to be applied solely to purchase and payment transactions. For example, an employee could fraudulently access a vendor master record and input their own bank account information. This results in a payment being made into the employee’s account. After taking the money, the employee accesses the vendor master file and reverses the change.
Data analytics can be run against vendor master change data to detect any change that is reversed within a short time frame.
How many procurement fraud signs are you aware of?
6. Invoices with no matching receiving support
This occurs when an employee colludes with a vendor and submits invoices for non-existent or fraudulent goods and services. The payment is approved by the employee, the vendor is paid, and the employee gets a kick-back.
In organizations that track the receipt of goods through a goods received system, a data analytic can identify any failure to find a match between an invoice and the goods received system. This can be extended to check for three-way matches, when appropriate, between a PO, the goods received records, and the invoice.
7. Unusually high pricing for goods and services
An employee may collude with a vendor and approve purchases at inflated rates, in order to receive a kick-back from the vendor.
An analytic can compare the average prices paid for goods and services across a broad range of vendors providing basically similar items.
8. Benford’s Law
Benford’s Law is an old favorite to detect numeric amounts that don’t fit expected patterns. It’s based on the observation that there is a statistical probability of the percentage of times that a given digit is in a given position in a string of numbers, such as amounts.
Many fraud solutions include a Benford capability that automatically produces a graph of the expected distribution of numbers. It highlights any that are statistically unusual. This finds the fraudsters who generate payments for personal benefit through false invoices or other means—and that use amounts that aren’t typical of actual payments.
It’s not always a given that an anomaly detected by Benford analysis is fraudulent—but it can be an indicator of something unusual, which might need a second look.
9. Round amounts
Earlier we said that fraudsters are often cunning. Now we caveat that with “not always.” Sometimes they do things that are not typical of legitimate transactions—like processing an invoice or payment transaction that is “rounded.” Of course, perfectly legitimate transactions can be round amounts. However, in practice, round amounts in payment systems are typically not common, particularly when sales tax and other calculations are applied.
A “round amount” data analytic can be used to quickly detect any amount that ends in an unusually long string of zeros. The calculation for this is often based on using a MOD function to determine whether a remainder is a zero.
10. Sequential invoices
Sometimes fraudsters make really stupid mistakes. An example would be an employee who sets up a phantom vendor account and submits invoices for fictitious goods and services—but fails to think about the way invoice numbers progress in the real world. For example, if the entire range of invoice numbers from Acme Cleaning over a two-year period is from “20101” to “20124,” it would imply that the vendor does not have any other business or customers. Of course, this could be valid in some circumstances, though unlikely.
A sequential invoice number test analyzes all the invoice numbers from each vendor over a given time frame and indicates the average range between numbers. By focusing investigation on those vendors with the smallest range, it can be a relatively quick process to determine if there is something unusual and potentially fraudulent.
An ongoing process
The 10 AP fraud detection analytics described above are a good place to start for most organizations. After starting with a series of relatively basic analytics and reviewing the value of the results, the next step is often to tweak processes.
Some analytics may not prove very useful in practice and may be replaced with others. That’s perfectly okay! Within a relatively short time frame, you can expect to be using a suite of automated analytics on a regular basis, establishing an important core element of an ongoing fraud detection program.
Learn how our analytics solution, ACL Robotics, can help you run a range of automated analytics for fraud detection and other GRC functions.
White paper
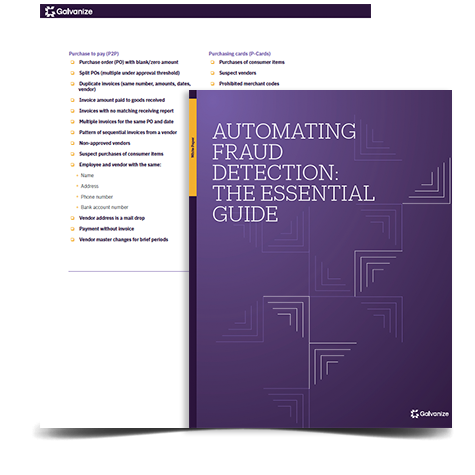
Automating fraud detection: The essential guide
You’ll learn about:
- The role of data analysis in fraud detection
- Automating fraud detection analytics and continuous monitoring
- Testing for fraud in key business process areas.


